
- Corn 1/4 to 1/2 lower
- Soybeans 2 ¾ to 4 ¼ lower
- Wheat 3 ¾ to 10 lower
- Basis Flat/Higher
- Live Cattle 58 higher (243.08)
- Lean Hogs 43 higher (366.15)
- Dow Jones 46 higher (49,569)
- Crude Oil 10 higher (62.75)
Ahead of the long holiday weekend, markets gave back a small portion of the large weekly gains as a trade deal with India and the potential for an expansion of trade with China was the bullish catalyst for the weekly rally. With no weather threat for South America’s enormous crops, everyone will be dissecting the likelihood of China’s adherence to the extra purchases moving forward. An acreage battle between corn and beans was not expected this spring in the US, but one may on the horizon with any more bullish US export news.
News and Notes:
- South America’s weather remains non-threatening as it is dry in north and central Brazil where bean harvest is speeding along (total crop 35-40% harvested) while the recently dry regions of southern Brazil and Arg have received beneficial rains over the last 7-10-days to help late season development. Yield estimates continue to rise for Brazil’s bean crop while Argentina’s corn crop fell slightly but has stabilized. A shot of spring like temperatures will hit most of the Midwest and south in the week ahead.
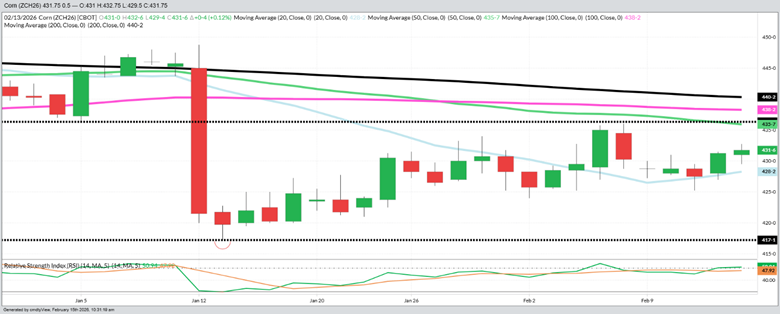
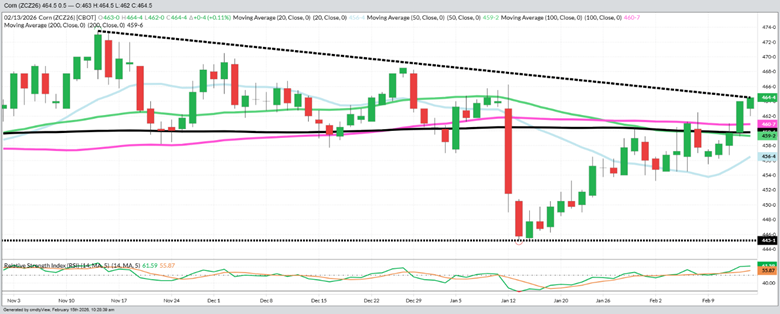
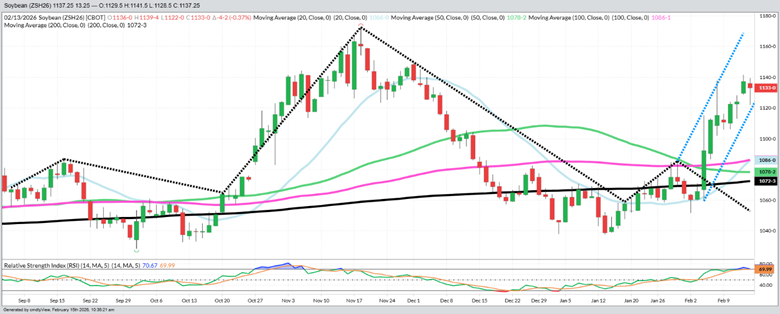
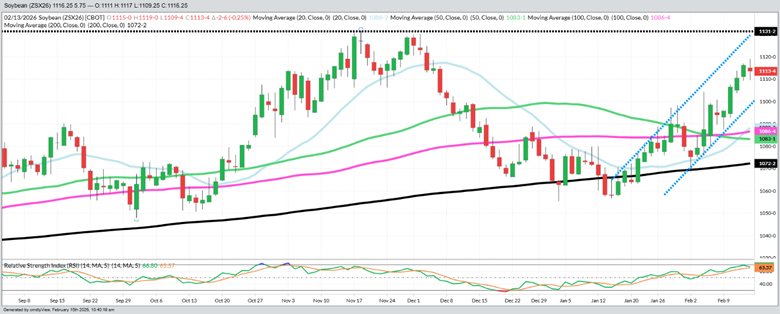
- The daily old and new crop charts for corn and beans are on Page 2 and show the lingering impact of the bearish January USDA report for old crop corn, while the Chinese news has produced more bullish excitement for old and new crop beans and new crop corn. The latest Chinese trade buying has been a strong influence for old crop beans (what China agreed to buy), new crop beans (trying to buy more US acres to avoid a sharp drop in domestic supplies) and new crop corn (trying to only lose 3-5 MA on normal crop rotation to beans) which has impressively improved those three charts. Old crop corn will face overhead technical resistance unless China is coerced into buying more corn, while the other three charts have both bullish momentum and bullish technical patterns. February is usually n historically bearish month, so the counter-seasonal rallies are very welcome. Funds are holding a modest 225 MBU short in corn and a 780 MBU long in beans which gives corn plenty of potential short-covering if a good reason develops. Beans are over-bought but can stay that way for weeks, so picking a tradable top will be a tall task. Continue to reward rallies with cash sales then think about ownership (if appropriate) on meaningful pullbacks to be positioned for the summer.
- Bean oil demand from the new trade deal with India for both edible and bio-fuel use will be one part of what may happen to the bean price into the spring. The second major moving part is will and can China buy another 8 MMT of old crop beans and buy another 24 MMT of 26/27 US production. That is a total (potentially) of 1.17 BBU ($12 billion) which would be 15% of the ‘25 and ‘26 US production. IF (big IF) China follows through, it will dramatically change US ending stocks over the next year.
- February begins the revenue-based insurance price discovery and halfway through, the average price for December corn is $4.59125 with November beans at $10.9770. Please have your crop insurance agent fully explain all the changes to this year’s insurance as there has been significant changes and many additional benefits for the farmer.
- Weekly Changes: Corn +1 1/2 (March ‘26), +6 3/4 (Dec ‘26), Beans +29 3/4 (May ‘26), +19 1/2 (Nov ‘26), Wheat +19 (July ’26), Crude -61, Diesel -425, Dow -636, US Dollar +687, Cattle +633, Feeder Cattle -128, Hogs -43, Cotton +105, Milk 32 (15.06).
Trying to develop a marketing plan with the massive risk and reward of the warming trade landscape with China is going to give everyone extra heart-burn this year. If you believe China will follow through and buy roughly $12 billion worth of US beans in the next year, patience is your plan. If you have no trust in China following through, aggressively selling the current rally is your plan. If like a reasonable person, you believe the result is somewhere in the middle, you sell the rally with a re-ownership strategy and patiently watch how this unfolds. Despite the industry chatter that China is already overstocked with beans, spending $12 billion on something that can be stored is not a big deal considering China sells about $300 billion of other goods to the US. Re-investing only 4% of US’s business is not a big number and would probably pay for itself within a few years. Remember the markets are closed on Monday for President’s Day. Have a great long weekend.
March 2026 Corn – Daily
December 2026 Corn – Daily
March 2026 Beans – Daily
November 2026 Beans – Daily
Sales Targets
Corn
Beans
Wheat
- 2024 Finished Finished Finished
- 100% Sold at $4.46 Avg 100% Sold at $11.13 Avg 100% Sold at $6.20 Avg
- 2025 Crop 10% at $4.55- March '26 Finished Finished
- 80% Sold at $4.44 Avg 100% Sold at $10.67 100% Sold at $6.24 Avg
- Current Price $4.32
- 2026 Crop 10% at $4.65 - Dec ‘26 10% at $11.25- Nov '26 On Hold– July ‘26
- 30% Sold at $4.72 45% Sold at $10.95 50% Sold at $6.13
- Current Price $4.65 $11.14 $5.57
%’s are total of expected yields. Bold Prices are Updated Sales Targets. * price includes trading
Previous Sales Levels
Corn
Beans
Wheat
-
2024 Sales Sales
May ’25 $4.41 (25% on 9-6-24)
May ’25 $4.55 (25% on 10-1-24)
May ’25 $4.45 (25% on 11-7-24)
May ’25 $4.50 (15% on 12-10-24)
Dec ’25 $4.30 (10% on 9-15-25)Nov ’24 $12.20 (25% on 5-22-24)
May ’25 $10.56 (25% on 9-3-24)
May ’25 $10.80 (25% on 9-23-24)
May ’25 $10.90 (25% on 9-24-24)July ’24 $6.60 (15% on 12-6-23)
July ’24 $6.35 (15% on 5-6-24)
July ’24 $6.65 (15% on 5-10-24)
Dec ’24 $5.80 (20% at 9-4-24)
Dec ’24 $5.95 (20% on 9-13-24)
Dec ’24 $6.10 (15% on 10-2-24) -
2025 Sales Sales
Dec ’25 $4.45 (25% on 11-7-24)
Dec ’25 $4.42 (25% on 12-11-24)
Mar ’26 $4.50 (10% on 10-28-25)
Mar ’26 $4.50 (10% on 12-12-25)
Mar ’26 $4.35 (10% on 2-5-26)Nov ’25 $10.60 (25% on 9-3-24)
Nov ’25 $10.90 (25% on 9-24-24)
Nov ’25 $10.25 (15% on 1-2-25)
Nov ’25 $10.55 (10% on 8-22-25)
Nov ’25 $10.52 (15% on 10-27-25)
Mar ’26 $11.05 (10% on 10-28-25)July ’25 $7.50 (20% on 5-22-24)
July ’25 $6.35 (25% on 10-1-24)
July ’25 $5.95 (15% on 2-3-25)
Sep ’25 $5.90 (20% on 6-20-25)
Dec ’25 $5.40 (20% on 7-3-25) -
2026 Sales Sales
Dec ’26 $4.75 (10% on 6-20-25)
Dec ’26 $4.70 (10% on 11-14-25)
Dec ’26 $4.70 (10% on 12-2-25)Nov ’26 $10.75 (15% on 8 21-25)
Nov ’26 $10.95 (10% on 10-27-25)
Nov ’26 $11.30 (10% on 12-2-25)
Nov ’26 $10.90 (10% on 1-28-26)July ’26 $6.45 (25% on 6-20-25)
July ’26 $5.80 (25% on 11-4-25)
Today’s Market Closes — Rounded to the Nearest Cent
Corn
- March $4.32
- May $4.42
- July $4.50
- Dec '26 $4.65
Beans
- March $11.33
- May $11.49
- July $11.61
- November $11.14
Wheat
- March $5.49
- May $5.49
- July $5.57
- Dec '26 $5.86
Other Closes
- Apr Diesel 2.3003 -101
- US Dollar 96.819 -18
- Cash Cattle $246 Trade
- Lean Hogs 86.95 +20
A Complete Overview of Current New Crop Market Conditions
Last Updated: 02/15/2026
Fundamentally
Technically
Short Term
Long Term
Volatility
Trade Rec
- Corn Neutral Bullish Neutral Neutral High Sell Rallies
- Soybeans Neut/Bearish Bullish Neutral Neut/Bearish High Sell Rallies
- Wheat Neutral Neut/Bullish Neutral Neut/Bearish High Sell Rallies
- Cattle Neut/Bullish Neut/Bullish Bearish Neut/Bearish High Sell Rallies
- Hogs Neut/Bullish Neut/Bullish Neut/Bullish Neutral High Sell Rallies
- Diesel Neut/Bearish Neut/Bearish Neut/Bearish Neut/Bearish High None
- Denotes positive change
- Denotes negative change
Any decision to purchase or sell as a result of the opinions expressed in this report will be the full responsibility of the person authorizing such transaction. No market data or other information is warranted by Reliance Capital Markets II LLC as to completeness or accuracy, express or implied, and is subject to change without notice. Any comments or statements made herein do not necessarily reflect those of Reliance Capital Markets II LLC, or their respective subsidiaries, affiliates, officers or employees. Disclaimer: Past performance is not indicative of future results. Strategic Trading Advisors is a registered DBA of Reliance Capital Markets ll LLC.

About Jody Lawrence
Jody Lawrence has been in the commodity brokerage and agriculture marketing business since 1992 and started Strategic Trading Advisors in 1999 and runs it today with his son Brady. The daily market comment his company publishes has over 7000 subscribers in 33 states and 3 countries and provides a concise overview of the world markets with ideas on farm hedging and marketing. Jody also travels the country giving 60-70 marketing meetings a year through his 22-year strategic partnership with Helena Agri-Enterprises.

About Brady Lawrence
Brady Lawrence is an Agriculture Market Specialist and Financial Advisor that focuses on commodities markets, futures and options brokerage, and helping individuals and families plan for retirement and their financial futures. Brady joined Jody at Strategic Trading Advisors in 2018 after college and supports the market research and brokerage sides of the business.