
- Corn 7 ¾ to 8 ½ higher
- Soybeans 3 to 7 ½ higher
- Wheat 11 to 11 ¾ higher
- Basis Flat/Higher
- Live Cattle 65 lower (231.10)
- Dow Jones 619 higher (53,250)
- Crude Oil 430 lower (80.40)
- Feeder Cattle 20 lower (344.83)
Sharply lower crude oil prices on a tentative ceasefire and new negotiations between the US and Iran were the overnight news that originally pressured all prices, but technical support held in each of the major grain and soy contracts to produce a solid and welcome rebound after the late July selloff. Rain over the last week and decent forecasts into mid-August have taken some fear premium out of prices, but China continues to be in the daily export reports for beans which has the trade again trying to estimate potential yield in an increasingly strong demand market. War news from either Russia/Ukraine and US/Iran will have important day to day impact, but supply and demand will move to the front of the line heading into the August 12th USDA report.
News and Notes:
- Over the last 5-days, the WCB and central Corn Belt received the best rains of the summer which pressured prices to end July. While most areas got solid amounts, there (like most summer rain events) were several key areas that were missed including E NE and W IA. The forecasts into mid-August call for drier conditions and above average temperatures. The US weather outlook is good but not great, so it is just a guess how much better weather can salvage of the corn yield losses in June/July.
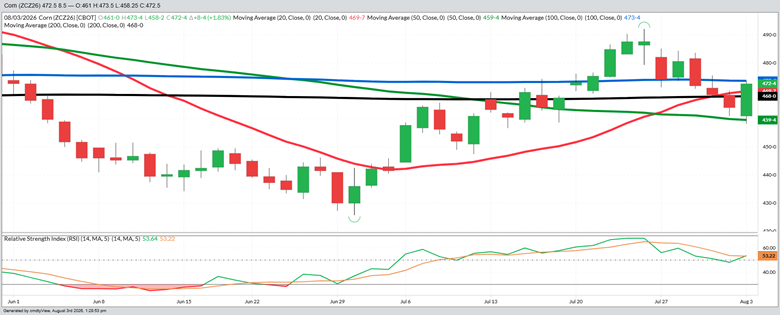
- The Nov bean, Sep wheat and Dec corn charts all traded down to and bounced from moving average support in early trade before finding buyers after last week’s selloff. The funds are long roughly 460 MBU of corn, 680 MBU of beans and back to holding a very small 50 MBU short in wheat. The Dec corn chart is on Page 2 and shows the above-mentioned pattern in today’s bounce from the 50-DMA (green line) and a 50% retracement of the late June to late July rally. Both overlapped in the $4.60 area. It is also interesting that today’s trade touched the 20, 50, 100 and 200-DMAs, which highlights the compression on the chart. A daily and weekly close back over $4.74 would turn the chart more bullish.
- Although Black Sea grain movement remains at a standstill with neither side talking much about a diplomatic agreement to allow safe shipping, neighboring countries are trying to set up back channels for negotiations. Any return to uninterrupted grain shipping in the region would be a market negative. When wheat rallied to over $7.10, an extended stoppage was fully prices in the market. Trading the wheat market is a nightmare but is critically important to watch as it is so tied with corn prices.
- China and Unknown were solid buyers in today’s morning sales announcements with China buying 19 MBU for 26/27 delivery while Unknown (probably China) bought 5.4 MBU for the same delivery period. The consistency of China’s daily and weekly buying will need to continue into the late September trade meeting in Washington. It will be interesting how the USDA/NASS project Chinese demand in the August 12th monthly report.
- President Trump again pulled out his phone this weekend and got on Truth Social to let the world know that more bombing in Iran was postponed as both sides begin more negotiations this week. Crude oil dropped sharply, back under $80 a barrel and closing below most major moving averages. Trading oil technically is a lost cause with this administration, but the world markets have become very comfortable rallying oil to $92-$94 when there is bombing and push it back to $70-$72 on any peace progress. Keep an eye on diesel (heating oil) futures and top off your tanks when September futures put in these sharp 40-50-cent breaks. Diesel futures are almost 40-cents off the high of 2-weeks ago.
With the calendar turning to August and school starting soon (ugh) it is time to turn our attention to the critical Wednesday August 12th USDA/NASS update where every column will be tweaked with the most important ones being US yield and whatever acreage changes the USDA makes after receiving the FSA and crop insurance data early next week. There are always the “chicken little” reports that surface of massive acreage and yield increases, and the USDA has certainly dine it in this report before, but the spring planting weather and increased CRP acreage enrollment does not make me think the USDA will find an additional 4-5 MA planted acres. It is a scary report, no doubt, and both agencies could do a much better job in their data collection, but we have to trade it and position accordingly.
Sales Targets
Corn
Beans
Wheat
- 2025 Crop Finished Finished Finished
- 100% Sold at $4.48 Avg 100% Sold at $10.67 100% Sold at $6.24 Avg
- 2026 Crop On Hold - Dec ‘26 10% at $12.75 – Nov ‘26 20% at $7.15– Sep ‘26
- 70% Sold at $4.88* 60% Sold at $11.42* 65% Sold at $6.24
- Current Price $4.73 $11.92 $6.51
- 2027 Crop 10% at $5.20 - Dec ‘27 10% at $12.15 – Nov ‘27 25% at $7.55 – July ‘27
- No Sales Yet 10% Sold at $11.50 25% Sold at $7.15
- Current Price $4.93 $11.61 $6.91
%’s are total of expected yields. Bold Prices are Updated Sales Targets. * price includes trading
December Corn – Daily
Today’s Market Closes — Rounded to the Nearest Cent
Corn
- September $4.49
- December $4.73
- March $4.88
- July $5.01
Beans
- September $11.71
- November $11.92
- March $12.12
- July $12.22
Wheat
- September $6.51
- December $6.69
- March $6.85
- July $6.91
Other Closes
- Sep Diesel 3.8755 -220
- Dec Cotton 82.57 +78
- Cash Cattle $240 Offer
- Lean Hogs 97.53 -133
Any decision to purchase or sell as a result of the opinions expressed in this report will be the full responsibility of the person authorizing such transaction. No market data or other information is warranted by Reliance Capital Markets II LLC as to completeness or accuracy, express or implied, and is subject to change without notice. Any comments or statements made herein do not necessarily reflect those of Reliance Capital Markets II LLC, or their respective subsidiaries, affiliates, officers or employees. Disclaimer: Past performance is not indicative of future results. Strategic Trading Advisors is a registered DBA of Reliance Capital Markets ll LLC.

About Jody Lawrence
Jody Lawrence has been in the commodity brokerage and agriculture marketing business since 1992 and started Strategic Trading Advisors in 1999 and runs it today with his son Brady. The daily market comment his company publishes has over 7000 subscribers in 33 states and 3 countries and provides a concise overview of the world markets with ideas on farm hedging and marketing. Jody also travels the country giving 60-70 marketing meetings a year through his 22-year strategic partnership with Helena Agri-Enterprises.

About Brady Lawrence
Brady Lawrence is an Agriculture Market Specialist and Financial Advisor that focuses on commodities markets, futures and options brokerage, and helping individuals and families plan for retirement and their financial futures. Brady joined Jody at Strategic Trading Advisors in 2018 after college and supports the market research and brokerage sides of the business.