
Current Trade:
Corn: 2 to 3 higher ($4.14 to $4.48)
Beans: 1 to 2 higher ($11.27 to $11.56)
Wheat: 6 to 9 higher ($5.89 to $6.31)
First Glance:
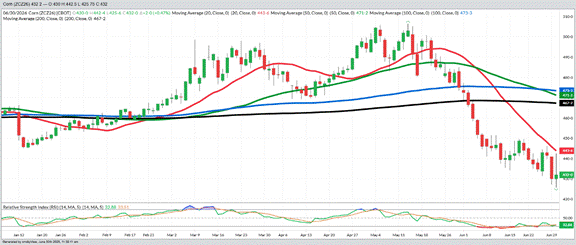
Corn
Planted Acreage: 95.343 MA (94.992 MA Estimate)
June 1st Stocks: 5.295 BBU (5.408 BBU Estimate)
- The April/May rains and cool weather did not change farmers’ planting intentions as corn planted acres were within 50,000 of the March report, which was well below the scared whisper number that an extra 1.5-2 MA had been planted but still above many estimates in the low 94 MA area. The market is higher on the withdrawal of the larger acreage number and the modest cut to quarterly stocks from the pre-report estimate. Corn contracts did make new contract lows this morning and easily gave up the early post-report double-digit gains to settle into a comfortable mid-range (but higher) trade. The current US heat is expecting to fade early next week which puts weather back in control of the corn market.
Beans
Planted Acreage: 85.365 MA (85.369 MA Estimate)
June 1st Stocks: 1.061 MBU (1.046 MBU Estimate)
- The estimated bean numbers were the most accurate as acreage was within 40,000 acres and stocks within 15 MBU. The bean market had been fearing the US farmer had switched 1-1.5 MA from corn to beans, but it turned out that high fertilizer prices and a wet spring did not force that move. Beans yield will not be decided until August, but today’s report is neutral to new crop in the $11.40-$11.60 range. Chinese demand and/or an August weather problem need to show up to push November futures back over $12.
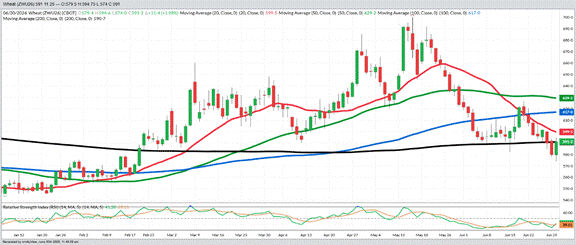
Wheat
Planted Acreage: 42.74 MA (43.858 MA Estimate)
June 1st Stocks: 920 MBU (934 MBU Estimate)
- Wheat got the most bullish surprise as acreage was over 1 MA lower than expected while wheat stocks were slightly lower. Despite a miserable 2026 US wheat crop, US stocks are still 65 MBU above 2025. Several world bullish factors like the Russian/Ukraine war, very poor Indian June monsoon and Europe crops under severe stress have not impacted price, bu the report has allowed a solid 16-cent bounce from this morning’s new 4-month low. Wheat needs corn to become bullish and vice versa.
Overview
US weather turns far less stressful after this weekend which is offered more resistance than support this week and without a major surprise in today’s report, the trade will go back to trading pollination weather.
The charts below look terrible and even today’s post-report rallies off the new contract lows in corn and recent lows in beans and wheat, do not change that perception. An argument might exist that all three markets made reversal DOJI (lower low, higher high and a higher finish) but we still have over an hour to trade in markets well off the post report highs.
No one really got what they wanted in today’s report as the bears did not get any ultra-bearish news and the bulls were only able to see some gains because the report was not ultra-bearish. But rallying because it was not ultra-bearish is not the same as rallying on a bullish report. For meaningfully higher prices we need to see China lower their US ag import tariffs and then show up at a weekly pace to meet their pledges from the May trade meeting. US weather is always a big factor in July and August, and a more impactful scare is needed to have any hope of retesting the spring highs. This will be today’s only report. Have a great afternoon.
December 2026 Corn
November 2026 Beans

September 2026 Wheat
Sales Targets
Corn
Beans
Wheat
- 2025 Crop Finished Finished Finished
- 100% Sold at $4.48 Avg 100% Sold at $10.67 100% Sold at $6.24 Avg
- 2026 Crop On Hold - Dec ‘26 On Hold – Nov ‘26 On Hold – Sep ‘26
- 60% Sold at $4.78 50% Sold at $11.05 65% Sold at $6.24
- Current Price $4.35 $11.43 $5.91
- 2027 Crop On Hold - Dec ‘27 On Hold – Nov ‘27 On Hold– July ‘27
- No Sales Yet 10% Sold at $11.50 25% Sold at $7.15
- Current Price $4.68 $11.34 $6.33
%’s are total of expected yields. Bold Prices are Updated Sales Targets. * price includes trading
Any decision to purchase or sell as a result of the opinions expressed in this report will be the full responsibility of the person authorizing such transaction. No market data or other information is warranted by Reliance Capital Markets II LLC as to completeness or accuracy, express or implied, and is subject to change without notice. Any comments or statements made herein do not necessarily reflect those of Reliance Capital Markets II LLC, or their respective subsidiaries, affiliates, officers or employees. Disclaimer: Past performance is not indicative of future results. Strategic Trading Advisors is a registered DBA of Reliance Capital Markets ll LLC.

About Jody Lawrence
Jody Lawrence has been in the commodity brokerage and agriculture marketing business since 1992 and started Strategic Trading Advisors in 1999 and runs it today with his son Brady. The daily market comment his company publishes has over 7000 subscribers in 33 states and 3 countries and provides a concise overview of the world markets with ideas on farm hedging and marketing. Jody also travels the country giving 60-70 marketing meetings a year through his 22-year strategic partnership with Helena Agri-Enterprises.

About Brady Lawrence
Brady Lawrence is an Agriculture Market Specialist and Financial Advisor that focuses on commodities markets, futures and options brokerage, and helping individuals and families plan for retirement and their financial futures. Brady joined Jody at Strategic Trading Advisors in 2018 after college and supports the market research and brokerage sides of the business.