
- Corn unch to 1 ¾ higher
- Soybeans 1 ¾ to 10 ½ higher
- Wheat 7 to 8 lower
- Basis Flat
- Live Cattle 198 higher (235.23)
- Lean Hogs 23 higher (93.73)
- Dow Jones 66 higher (47,356)
- Crude Oil 266 higher (96.16)
Clarification by President Trump on the timing of the trade meetings in Beijing and higher crude oil helped the corn and bean markets stabilize and post modest rallies while wheat fell as recent futures rallies have out-priced US bushels to the world market. With some hope that China will still be in the market for US beans and President Trump scheduling the release of the new RVO/SRE bio-fuel guidelines at a March 27th White House ceremony for Agriculture Appreciation Day, the markets appear ready to stabilize if the developments in Iran do not further alter the world energy picture.
News and Notes:
- The brutal cold of the last few days in the US will quickly change to above normal late March temperatures in many states by this weekend. With planting starting in the far south and first plant insurance dates creeping closer by the day, the US forecasts will take on greater market importance in the weeks to come. SA remains mostly problem free, but quality and moisture issues are being reported in Brazil’s bean exports which are being addressed by Chinese inspectors. Brazil’s bean harvest and corn planting should be done on a normal pace in the 7-10-days.
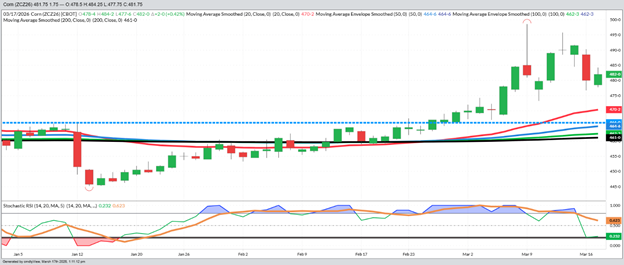
- The daily December corn chart is on Page 2 and shows this week’s dip to and easy hold above all the technical moving average support. Today’s inability to take out Monday’s low is helpful as is the bottom section (Relative Strength Index), which indicates the very overbought condition has returned to more normal levels. The funds are still long a lot of corn, but the chart looks pretty good considering the massive washout in beans this week.
- As with any major USDA report, the private estimates will be coming out over the next week for the planted acreage estimates for the March 31st report. S & P Global released their estimates today with corn acres falling roughly 4 MA from 2025 to 95.2 while beans pick up those acres and a few from cotton and rice to gain 5 MA to 85 MA. For the last decade plus, the total of US corn and planted acres have floated between 178 and 180 MA as logistics and profitability have kept those totals from increasing. The USDA Ag Outlook estimate from February has totals at 94 MA for corn and 85 MA for beans. An important factor for both is that higher nitrogen prices were not part of the calculation when these were put together. If urea and potash prices do not fall back soon, the corn acreage number will be negatively impacted. A sub-94 MA planted corn acreage and 86 MA plus for beans, means corn would be well supported through the season with more pressure on new crop beans.
- China will become a larger player in re-opening the Straits of Hormuz as their crude oil supply dwindles and domestic prices skyrocket. US prices at the pump are certainly higher, but the US does not have any shortages as the world’s largest producer and exporter of oil. President Trump wants worldwide help to end Iran’s threat and controlling the Straits is an easy way to force them to help.
- Drought conditions and high winds have caused wildfires that have burned thousands of acres in NE and killed many cattle. This is not the only reason for this week’s rally, but it is bad news for an industry with a shortage of cattle on feed.
- Please listen to last week’s Helena FieldLink podcast special on what I see as the impact of the war with Iran is having on our markets.
It was good to see corn and beans celebrate St Patrick’s Day by putting up some green numbers, but after Monday’s thrashing, it was not a surprise. With this administration’s announce first and plan later mentality, the US farm community needs to see more action on lowering input costs and finding more export markets, rather than just a ceremony. The rest of March is developing as a very busy and news filled 2-weeks as the daily developments in Iran, trade news with China, EPA mandate announcements, and the March 31st Planted Acreage estimates. Each of these events could produce big moves in either direction (as we saw Monday), but a bullish sweep could set up a far more interesting early April planting season than expected just a few weeks ago. The volatility will calm from time to time, but the overall attitude of all of the market participants is elevated apprehension that only time and the end of the war will calm.
Sales Targets
Corn
Beans
Wheat
- 2024 Crop Finished Finished Finished
- 100% Sold at $4.46 Avg 100% Sold at $11.13 Avg 100% Sold at $6.20 Avg
- 2025 Crop On Hold - May '26 Finished Finished
- 90% Sold at $4.45 Avg 100% Sold at $10.67 100% Sold at $6.24 Avg
- Current Price $4.54
- 2026 Crop On Hold - Dec ‘26 On Hold– Nov '26 On Hold– July ‘26
- 50% Sold at $4.73 55% Sold at $11.01 50% Sold at $6.13
- Current Price $4.82 $11.31 $6.01
%’s are total of expected yields. Bold Prices are Updated Sales Targets. * price includes trading
December Corn - Daily
Today’s Market Closes — Rounded to the Nearest Cent
Corn
- May $4.54
- July $4.66
- September $4.68
- December $4.82
Beans
- May $11.57
- July $11.71
- September $11.32
- November $11.31
Wheat
- May $5.90
- July $6.01
- September $6.13
- December $6.30
Other Closes
- Apr Diesel 4.0100 +1700
- US Dollar 99.320 -148
- Cash Cattle 245 Offer
- Feeder Cattle 359.80 +435
Any decision to purchase or sell as a result of the opinions expressed in this report will be the full responsibility of the person authorizing such transaction. No market data or other information is warranted by Reliance Capital Markets II LLC as to completeness or accuracy, express or implied, and is subject to change without notice. Any comments or statements made herein do not necessarily reflect those of Reliance Capital Markets II LLC, or their respective subsidiaries, affiliates, officers or employees. Disclaimer: Past performance is not indicative of future results. Strategic Trading Advisors is a registered DBA of Reliance Capital Markets ll LLC.

About Jody Lawrence
Jody Lawrence has been in the commodity brokerage and agriculture marketing business since 1992 and started Strategic Trading Advisors in 1999 and runs it today with his son Brady. The daily market comment his company publishes has over 7000 subscribers in 33 states and 3 countries and provides a concise overview of the world markets with ideas on farm hedging and marketing. Jody also travels the country giving 60-70 marketing meetings a year through his 22-year strategic partnership with Helena Agri-Enterprises.

About Brady Lawrence
Brady Lawrence is an Agriculture Market Specialist and Financial Advisor that focuses on commodities markets, futures and options brokerage, and helping individuals and families plan for retirement and their financial futures. Brady joined Jody at Strategic Trading Advisors in 2018 after college and supports the market research and brokerage sides of the business.