
- Corn 1 ½ to 2 higher
- Soybeans 1 ½ to 3 ½ higher
- Wheat 11 to 6 ¾ lower
- Basis Flat
- Live Cattle 295 lower (231.23)
- Dow Jones 440 lower (54,054)
- Crude Oil 203 higher (77.26)
- Feeder Cattle 528 lower (348.05)
Early losses turned into modest gains for both corn and beans as crude oil rallied and technical support held the early breaks. Wheat was the weak link in today’s trade despite the Black Sea still closed due to the war. After 2-weeks of intense rain and technically related selling, the markets are sitting on long-term support and seeing strong demand to help offset the new bearish weather developments.
News and Notes:
- When the weather forecasts changed last week to wetter, most Corn Belt farmers were happy about the upcoming rain. But there has been significant flooding in this week’s downpours to figure into the equation. This year’s weather continues to be wildly inconsistent. The noon forecast models are consistent with rain in the eastern 2/3 of the Corn Belt while the WCB and Plains remained parched.
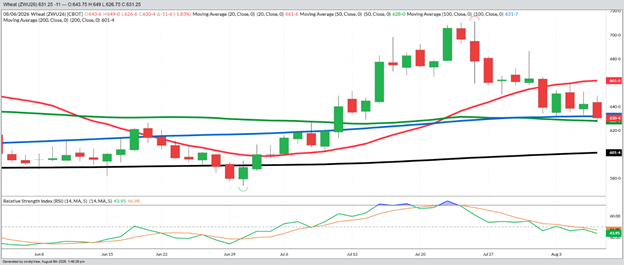
- The corn and bean charts have been so entertaining lately that it has been a while since we used a wheat chart. The September daily wheat chart is on Page 2 and shows the collapse in prices over the last 2-weeks and today’s make or break trade down to the congestion of the 100-DMA (blue line) and 50-DMA (green) that have both acted as support since the breakout in mid-July. The bounce off the daily low to close back over the 50-DMA is important after a brutal 75-cent break since the late July high. One interesting thing during the last 2-weeks ‘ collapse is that the funds only added roughly 80,000 contracts (40 MBU) to their next short position. The selloff was largely driven by grower hedging as the speculative community did not move their position in relation to the size of the price move. A bottom will come when the weak longs and farmer hedgers are out of the market.
- A major private European ag analytical company again lowered their EU corn production forecast by another 180 MBU for total production of just 1.94 BBU, which is down 2.2 BBU from the 2025 crop.
- Crude oil rallied today as details of a potential agreement between Iran and Oman (their neighbor on the other side of the Strait) showed that basically everybody except the US and their allies can use the Strait once it is reopened. The US is supporting but not involved in the negotiations, so I expect some negative words out of Washington, probably this weekend, condemning the potential deal. This is a major problem for the Republicans in the mid-term elections that are rapidly approaching.
- China was announced as a buyer of two cargoes of beans in this morning’s daily sales report and the weekly sales were decent for old crop but remain strong for corn and everything in the bean complex for the 26/27 marketing year. No one can argue about the support that world and domestic demand is adding to prices, with corn stocks continuing to shrink from all categories of demand.
- Yield estimates continue to be released ahead of next Wednesday’s USDA report. The corn yield estimates ranged from 181.4 (AgResource) to 184.8 (StoneX) with the rest somewhere in between. What is being shown is that there is absolutely no correlation between these estimates and the crop ratings that would struggle to forecast a yield over 180 if taken at historic face value. This could be the year that the outrage against the USDA weekly crop ratings and the USDA forecasted yields pushes the ongoing forces of reorganization to abandon or restructure those reports. We found in the Trump 1.0 administration, when the government and the USDA were shut down for several months, that the market had done an exceptional job of assembling their own information with very little volatility in the markets once the reports were finally released. Fix or close it, continues to be the mantra at the farmer meetings I attend. I completely agree.
There is no historical trend as to what the trade changes the week before mean for the reaction to the USDA report, but the fear of higher acres and higher yield that were present before the July report is still in play. Prices do get to points where it is hard to have a wildly bearish report and the collapses over the last 2-weeks may be accomplishing that. If the USDA holds corn yield below 184 and does not add more than 500,000 acres to planted corn, the markets will rally only because of the relief that the USDA did not crush the markets. This is what happened after the July report. Fear creates sell offs, and a removal of that fear creates rallies. Let’s hope for the second after the release.
Sales Targets
Corn
Beans
Wheat
- 2025 Crop Finished Finished Finished
- 100% Sold at $4.48 Avg 100% Sold at $10.67 100% Sold at $6.24 Avg
- 2026 Crop On Hold - Dec ‘26 10% at $12.75 – Nov ‘26 20% at $7.15– Sep ‘26
- 70% Sold at $4.88* 60% Sold at $11.42* 65% Sold at $6.24
- Current Price $4.62 $11.78 $6.31
- 2027 Crop 10% at $5.20 - Dec ‘27 10% at $12.15 – Nov ‘27 25% at $7.55 – July ‘27
- No Sales Yet 10% Sold at $11.50 25% Sold at $7.15
- Current Price $4.90 $11.59 $6.77
%’s are total of expected yields. Bold Prices are Updated Sales Targets. * price includes trading
September Wheat – Daily
Today’s Market Closes — Rounded to the Nearest Cent
Corn
- September $4.39
- December $4.62
- March $4.78
- July $4.92
Beans
- September $11.60
- November $11.78
- March $11.99
- July $12.13
Wheat
- September $6.31
- December $6.51
- March $6.67
- July $6.77
Other Closes
- Sep Diesel 3.8819 +857
- Dec Cotton 83.16 +14
- Cash Cattle $235 Trade
- Lean Hogs 95.50 -110
Any decision to purchase or sell as a result of the opinions expressed in this report will be the full responsibility of the person authorizing such transaction. No market data or other information is warranted by Reliance Capital Markets II LLC as to completeness or accuracy, express or implied, and is subject to change without notice. Any comments or statements made herein do not necessarily reflect those of Reliance Capital Markets II LLC, or their respective subsidiaries, affiliates, officers or employees. Disclaimer: Past performance is not indicative of future results. Strategic Trading Advisors is a registered DBA of Reliance Capital Markets ll LLC.

About Jody Lawrence
Jody Lawrence has been in the commodity brokerage and agriculture marketing business since 1992 and started Strategic Trading Advisors in 1999 and runs it today with his son Brady. The daily market comment his company publishes has over 7000 subscribers in 33 states and 3 countries and provides a concise overview of the world markets with ideas on farm hedging and marketing. Jody also travels the country giving 60-70 marketing meetings a year through his 22-year strategic partnership with Helena Agri-Enterprises.

About Brady Lawrence
Brady Lawrence is an Agriculture Market Specialist and Financial Advisor that focuses on commodities markets, futures and options brokerage, and helping individuals and families plan for retirement and their financial futures. Brady joined Jody at Strategic Trading Advisors in 2018 after college and supports the market research and brokerage sides of the business.