
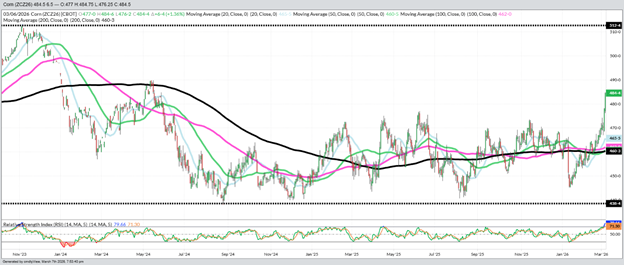
- Corn 6 ½ to 8 ¼ higher
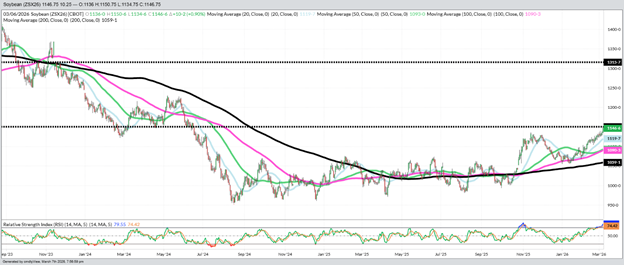
- Soybeans 21 ½ to 10 ¼ higher
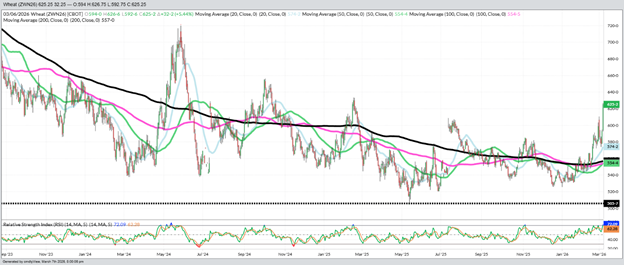
- Wheat 30 ¼ to 33 higher
- Basis Flat
- Live Cattle 395 lower (234.58)
- Lean Hogs 5 lower (95.63)
- Dow Jones 475 lower (47,817)
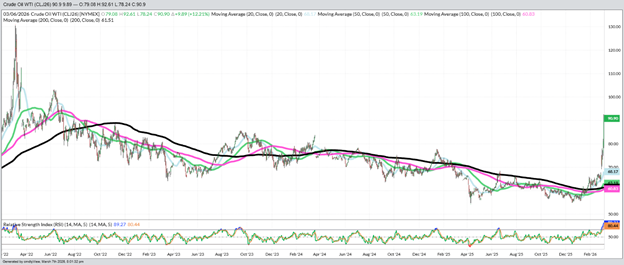
- Crude Oil 989 higher (90.90)
A week into the war with Iran produced enormous moves in most markets as the closing of the Straits of Hormuz rocketed crude oil prices higher which pulled corn and beans sharply higher while wheat moved higher on the world shipping problems. A diplomatic end to the war seems unlikely as President Trump is willing to stay the course until Iran’s new leadership is more Israel and world friendly. It is impossible to predict the timing or duration of this rally, so continue to reward this rally with old and new crop bushels because when the Straits re-open, crude oil will fall as quickly as it has risen taking down everything that it supported this week.
News and Notes:
- Argentina’s late maturing corn will receive plenty of rain in the next week with the recently planted safrinha corn crop in Brazil will see a perfect mixture of rain and temperatures for the next 10-14-days. The weak La Nina/El Nino pattern continues to favor big production numbers for SA. The US forecast looks more springlike with warming temperatures.
- The daily continual charts for December corn, November beans, July wheat, and April crude oil are on Page 2 and show the daily action of the most bullish week we have seen for those markets in years, and probably ever. The rallies were accelerated by fund short covering in the grains, fearful end user buying and the ever-growing relationship between the movement in the crude, diesel and unleaded gas and corn (ethanol) and beans (bean oil). Funds are now long corn and the entire soy complex and now long wheat for the first time in 3 ½ years. Oil prices will drive direction until the Straits of Hormuz re-open.
- No one likes higher fuel prices, but farmers benefit more when fuel rallies because it rallies corn and beans. The relationship between diesel and bean oil and gas and ethanol was noticeable. Look at it this way, for every 1000 gallons of diesel used annually on farm, this week cost you $1000, for every 1000 bushels of corn you have stored this week made you $1200, for every new crop bushel you made $1500. The bean math is +$3000 and +$1850. It is hard to have both high corn and bean prices and low fuel prices (Covid is the only example) as the renewable fuel industry has grown.
- The 2025 old crop corn Sales Target was hit in Friday’s rally to reward this week’s rally. This pushes old crop corn sales to 90% with 2025 corn Sales Target now On Hold. The Sales Target for 2026 new crop sales was missed by 1/2 -cent in Friday’s trade and will be hit if Sunday’s night opens higher. It is frustrating that uncertainty of a trade war and a record SA bean crop left most without any remaining beans, but if the crude oil rally continues and the EPA bio-fuel recommendations are larger than expected and signed into law, the re-ownership plan suggested last month will pay off.
- Many of you are fretting about not having enough bushels left to take advantage of the current rally. It is frustrating but there are a lot of costs in storing bushels and waiting for these type rallies. But considering storage costs (paid or on-farm), interest expense, opportunity cost of not having the cash and shrink, the costs mount up waiting on a rally. Conservatively figuring 3-cents per month for corn, storing for a year means you need a 36-cent rally just to break even. To date, the 2026 corn rally has been 16-cents. Patience in life is a virtue until it turns into inaction in your marketing plan.
- Weekly Changes: Corn + 12 (May ‘26), + 15 (Dec ‘26), Beans + 30 (May ‘26), +18 1/2 (Nov ‘26), Wheat +26 1/2 (July ’26), Crude +2388, Diesel +10266, Dow - 1183, US Dollar +1144, Cattle +235, Feeder Cattle +20, Hogs -10, Cotton -84, Milk -29 (16.98).
What a week. If you just took this week’s corn, bean and wheat rallies at face value you would be thrilled with the new and unexpected sales opportunities. Unfortunately, the rallies are coming as a result of new war that could last much longer than first thought and potentially send both the US and the world into a short-term period of sharp energy inflation and further slow a US economy that saw worse than expected employment numbers on Friday. With world equity markets falling sharply from both of these shocks and energy prices rising sharply, the world economy is moving into concerning territory. No breakthrough news was announced this weekend on a cease fire or reopening the Straits, so opening calls are higher. It is all about oil price.
December Corn – Daily
November Beans - Daily
July Wheat – Daily
April Crude Oil – Daily
Sales Targets
Corn
Beans
Wheat
- 2024 Crop Finished Finished Finished
- 100% Sold at $4.46 Avg 100% Sold at $11.13 Avg 100% Sold at $6.20 Avg
- 2025 Crop On Hold - May '26 Finished Finished
- 90% Sold at $4.45 Avg 100% Sold at $10.67 100% Sold at $6.24 Avg
- Current Price $4.61
- 2026 Crop 10% at $4.85 - Dec ‘26 On Hold– Nov '26 On Hold– July ‘26
- 40% Sold at $4.70 55% Sold at $11.01 50% Sold at $6.13
- Current Price $4.85 $11.47 $6.25
%’s are total of expected yields. Bold Prices are Updated Sales Targets. * price includes trading
Previous Sales Levels
Corn
Beans
Wheat
-
2024 Sales Sales
May ’25 $4.41 (25% on 9-6-24)
May ’25 $4.55 (25% on 10-1-24)
May ’25 $4.45 (25% on 11-7-24)
May ’25 $4.50 (15% on 12-10-24)
Dec ’25 $4.30 (10% on 9-15-25)Nov ’24 $12.20 (25% on 5-22-24)
May ’25 $10.56 (25% on 9-3-24)
May ’25 $10.80 (25% on 9-23-24)
May ’25 $10.90 (25% on 9-24-24)July ’24 $6.60 (15% on 12-6-23)
July ’24 $6.35 (15% on 5-6-24)
July ’24 $6.65 (15% on 5-10-24)
Dec ’24 $5.80 (20% at 9-4-24)
Dec ’24 $5.95 (20% on 9-13-24)
Dec ’24 $6.10 (15% on 10-2-24) -
2025 Sales Sales
Dec ’25 $4.45 (25% on 11-7-24)
Dec ’25 $4.42 (25% on 12-11-24)
Mar ’26 $4.50 (10% on 10-28-25)
Mar ’26 $4.50 (10% on 12-12-25)
Mar ’26 $4.35 (10% on 2-5-26)
May ’26 $4.55 (10% om 3-6-26)Nov ’25 $10.60 (25% on 9-3-24)
Nov ’25 $10.90 (25% on 9-24-24)
Nov ’25 $10.25 (15% on 1-2-25)
Nov ’25 $10.55 (10% on 8-22-25)
Nov ’25 $10.52 (15% on 10-27-25)
Mar ’26 $11.05 (10% on 10-28-25)July ’25 $7.50 (20% on 5-22-24)
July ’25 $6.35 (25% on 10-1-24)
July ’25 $5.95 (15% on 2-3-25)
Sep ’25 $5.90 (20% on 6-20-25)
Dec ’25 $5.40 (20% on 7-3-25) -
2026 Sales Sales
Dec ’26 $4.75 (10% on 6-20-25)
Dec ’26 $4.70 (10% on 11-14-25)
Dec ’26 $4.70 (10% on 12-2-25)
Dec ‘26 $4.65 (10% on 2-24-26)Nov ’26 $10.75 (15% on 8 21-25)
Nov ’26 $10.95 (10% on 10-27-25)
Nov ’26 $11.30 (10% on 12-2-25)
Nov ’26 $10.90 (10% on 1-28-26)July ’26 $6.45 (25% on 6-20-25)
July ’26 $5.80 (25% on 11-4-25)
Today’s Market Closes — Rounded to the Nearest Cent
Corn
- May $4.61
- July $4.71
- September $4.72
- December $4.85
Beans
- May $12.01
- July $12.13
- September $11.55
- November $11.47
Wheat
- May $6.17
- July $6.25
- September $6.37
- December $6.52
Other Closes
- Apr Diesel 3.6224 +81
- US Dollar 98.709 -300
- Cash Cattle $243 Trade
- Feeder Cattle 355.63 -698
A Complete Overview of Current New Crop Market Conditions
Last Updated: 03/08/2026
Fundamentally
Technically
Short Term
Long Term
Volatility
Trade Rec
- Corn Neut/Bullish Bullish Neut/Bullish Neut/Bullish High Sell Rallies
- Soybeans Neut/Bullish Bullish Neut/Bullish Bearish High Sell Rallies
- Wheat Neut/Bullish Bullish Neut/Bullish Neut/Bearish High Sell Rallies
- Cattle Neutral Neut/Bearish Neut/Bullish Bearish High Sell Rallies
- Hogs Neutral Neut/Bearish Neut/Bullish Neutral High Sell Rallies
- Diesel Bullish Bullish Neut/Bullish Neut/Bearish High None
- Denotes positive change
- Denotes negative change
Any decision to purchase or sell as a result of the opinions expressed in this report will be the full responsibility of the person authorizing such transaction. No market data or other information is warranted by Reliance Capital Markets II LLC as to completeness or accuracy, express or implied, and is subject to change without notice. Any comments or statements made herein do not necessarily reflect those of Reliance Capital Markets II LLC, or their respective subsidiaries, affiliates, officers or employees. Disclaimer: Past performance is not indicative of future results. Strategic Trading Advisors is a registered DBA of Reliance Capital Markets ll LLC.

About Jody Lawrence
Jody Lawrence has been in the commodity brokerage and agriculture marketing business since 1992 and started Strategic Trading Advisors in 1999 and runs it today with his son Brady. The daily market comment his company publishes has over 7000 subscribers in 33 states and 3 countries and provides a concise overview of the world markets with ideas on farm hedging and marketing. Jody also travels the country giving 60-70 marketing meetings a year through his 22-year strategic partnership with Helena Agri-Enterprises.

About Brady Lawrence
Brady Lawrence is an Agriculture Market Specialist and Financial Advisor that focuses on commodities markets, futures and options brokerage, and helping individuals and families plan for retirement and their financial futures. Brady joined Jody at Strategic Trading Advisors in 2018 after college and supports the market research and brokerage sides of the business.