
- Corn ½ to 1 lower
- Soybeans 2 to 2 ½ lower
- Wheat 5 to 6 ¼ lower
- Basis Flat
- Live Cattle 343 lower (250.05)
- Dow Jones 289 lower (49,742)
- Crude Oil 20 lower (95.00)
- Feeder Cattle 608 lower (366.33)
Sharp early losses in crude oil pulled corn, beans, and wheat lower to technical support where recent sellers began to take profits allowing the raw material markets to cut losses significantly. The US equity markets all posted new highs in early trade on strong earnings and hope for a peace deal, before reversing when crude oil reversed. Daily trade direction remains entirely driven by US/Iran negotiations but with disappointing weekly export sales and uncertain expectations for next week’s US/China trade meeting, there are fewer bullish factors if peace is negotiated and crude oil falls back to more normal levels.
News and Notes:
- Drier and warmer mid-day forecasts remain consistent for most of the Midwest and Corn Belt as US planting moves quickly along. Brazil’s safrinha weather remains non-stressful for 2/3 of the belt while recent rains have helped the drier areas.
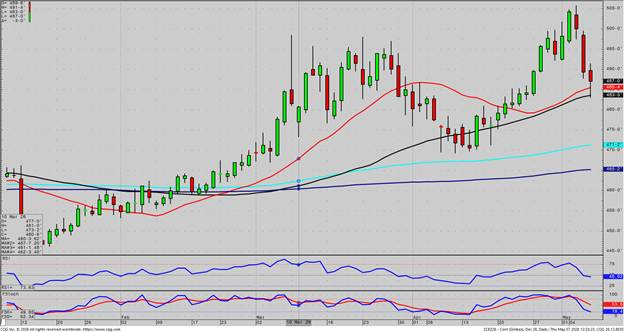
- The December corn daily chart is on Page 2 and shows today’s sharp break to trade under the 20-DMA (red line) and the 50-DMA (black line) before finding technical support and buyers as crude oil rallied. Ignoring the outside factors of a possible peace deal, the technical picture is neutral to bullish as the correction stopped where it needed to and corrected the extremely overbought conditions (bottom two charts) from the April rally. The funds are still long, over 1.5 BBU but obviously were ready to defend their position at the 50-DMA. If Friday’s closes remain above both moving averages that were compromised today, the chart looks good, but possibly at a new lower range from $4.83 to $4.93.
- The US/China trade summit will be next Thursday and Friday in China and while ag specific news or purchases were announced this week ahead of the meeting, it was announced that the Chairman of Boeing aviation will be going with the President with China expected to purchase more big planes from Boeing. The old crop bean markets rallied strongly on Monday when confirmation of the meeting was announced but have since pulled back waiting on signed contracts rather than hope.
- The weekly export totals were not spectacular with all sales in the middle of pedestrian expectations with beans below. Weekly ethanol production numbers were also weak with only 299 Mga produced, which is 31 Mga below the weekly average to hit the USDA’s corn used for ethanol estimate.
To borrow a phrase from popular movie culture, the trade is moving entirely on “ Peace On, Peace Off” news and rumors. Corn’s technical bounce was explained above but a similar test of and bounce from important moving average support was also seen in July wheat, November beans, and June crude oil. Without a signed peace deal, a few quiet days in the Straits and a concrete plan to re-open the Straits, the charts will add another wrinkle in watching the markets and deciding on when to potentially add put options (set floors on rallies) or buyback bushels with call options (re-own on breaks) as part of your hedge strategy. The charts also work well to help set cash and futures sales targets in your marketing plan. Friday’s positioning will be driven by the latest news on the Iran/US peace talks, preparing for another uncertain weekend, next Tuesday’s May USDA update, and adding or subtracting trade premium ahead of the Trump/Xi trade summit next week.
Sales Targets
Corn
Beans
Wheat
- 2025 Crop Finished Finished Finished
- 100% Sold at $4.48 Avg 100% Sold at $10.67 100% Sold at $6.24 Avg
- 2026 Crop On Hold - Dec ‘26 On Hold – Nov ‘26 15% at $6.60– July ‘26
- 60% Sold at $4.78 50% Sold at $11.05 50% Sold at $6.13
- Current Price $4.90 $11.74 $6.12
- 2027 Crop 10% at $5.15 - Dec ‘27 On Hold – Nov ‘27 25% at $7.15– July ‘27
- No Sales Yet 10% Sold at $11.50 No Sales Yet
- Current Price $5.01 $11.36 $6.76
%’s are total of expected yields. Bold Prices are Updated Sales Targets. * price includes trading
December Corn - Daily
Today’s Market Closes — Rounded to the Nearest Cent
Corn
- July $4.68
- September $4.74
- December $4.90
- March $5.03
Beans
- July $11.92
- September $11.67
- November $11.74
- January $11.86
Wheat
- July $6.12
- September $6.27
- December $6.48
- March $6.67
Other Closes
- June Diesel 3.8310 +460
- Dec Cotton 83.69 -17
- Cash Cattle $256 Trade
- Lean Hogs 91.50 -20
Any decision to purchase or sell as a result of the opinions expressed in this report will be the full responsibility of the person authorizing such transaction. No market data or other information is warranted by Reliance Capital Markets II LLC as to completeness or accuracy, express or implied, and is subject to change without notice. Any comments or statements made herein do not necessarily reflect those of Reliance Capital Markets II LLC, or their respective subsidiaries, affiliates, officers or employees. Disclaimer: Past performance is not indicative of future results. Strategic Trading Advisors is a registered DBA of Reliance Capital Markets ll LLC.

About Jody Lawrence
Jody Lawrence has been in the commodity brokerage and agriculture marketing business since 1992 and started Strategic Trading Advisors in 1999 and runs it today with his son Brady. The daily market comment his company publishes has over 7000 subscribers in 33 states and 3 countries and provides a concise overview of the world markets with ideas on farm hedging and marketing. Jody also travels the country giving 60-70 marketing meetings a year through his 22-year strategic partnership with Helena Agri-Enterprises.

About Brady Lawrence
Brady Lawrence is an Agriculture Market Specialist and Financial Advisor that focuses on commodities markets, futures and options brokerage, and helping individuals and families plan for retirement and their financial futures. Brady joined Jody at Strategic Trading Advisors in 2018 after college and supports the market research and brokerage sides of the business.